emilio_conde_portfolio
Emilio Conde Data Science Portfolio
Predicting Startups Success
Note: The output is in an HTML file. For accurate visualization, please download the file.
This project examines the key differences between businesses started by one person and those started by a team of co-founders. The goal is to figure out what makes a company successful and what might cause it to close or face acquisition.
- Data was taken from Pitchbook Platform and extracted via web scraping through entrepreneur’s LinkedIn profiles.
- The analysis includes differences between funding rounds, funding location, skill comparison across teams, and more.
- Model was built using logistic regression
- 90%+ accuracy across both training and testing datasets.
- Predictions were made on data from real companies
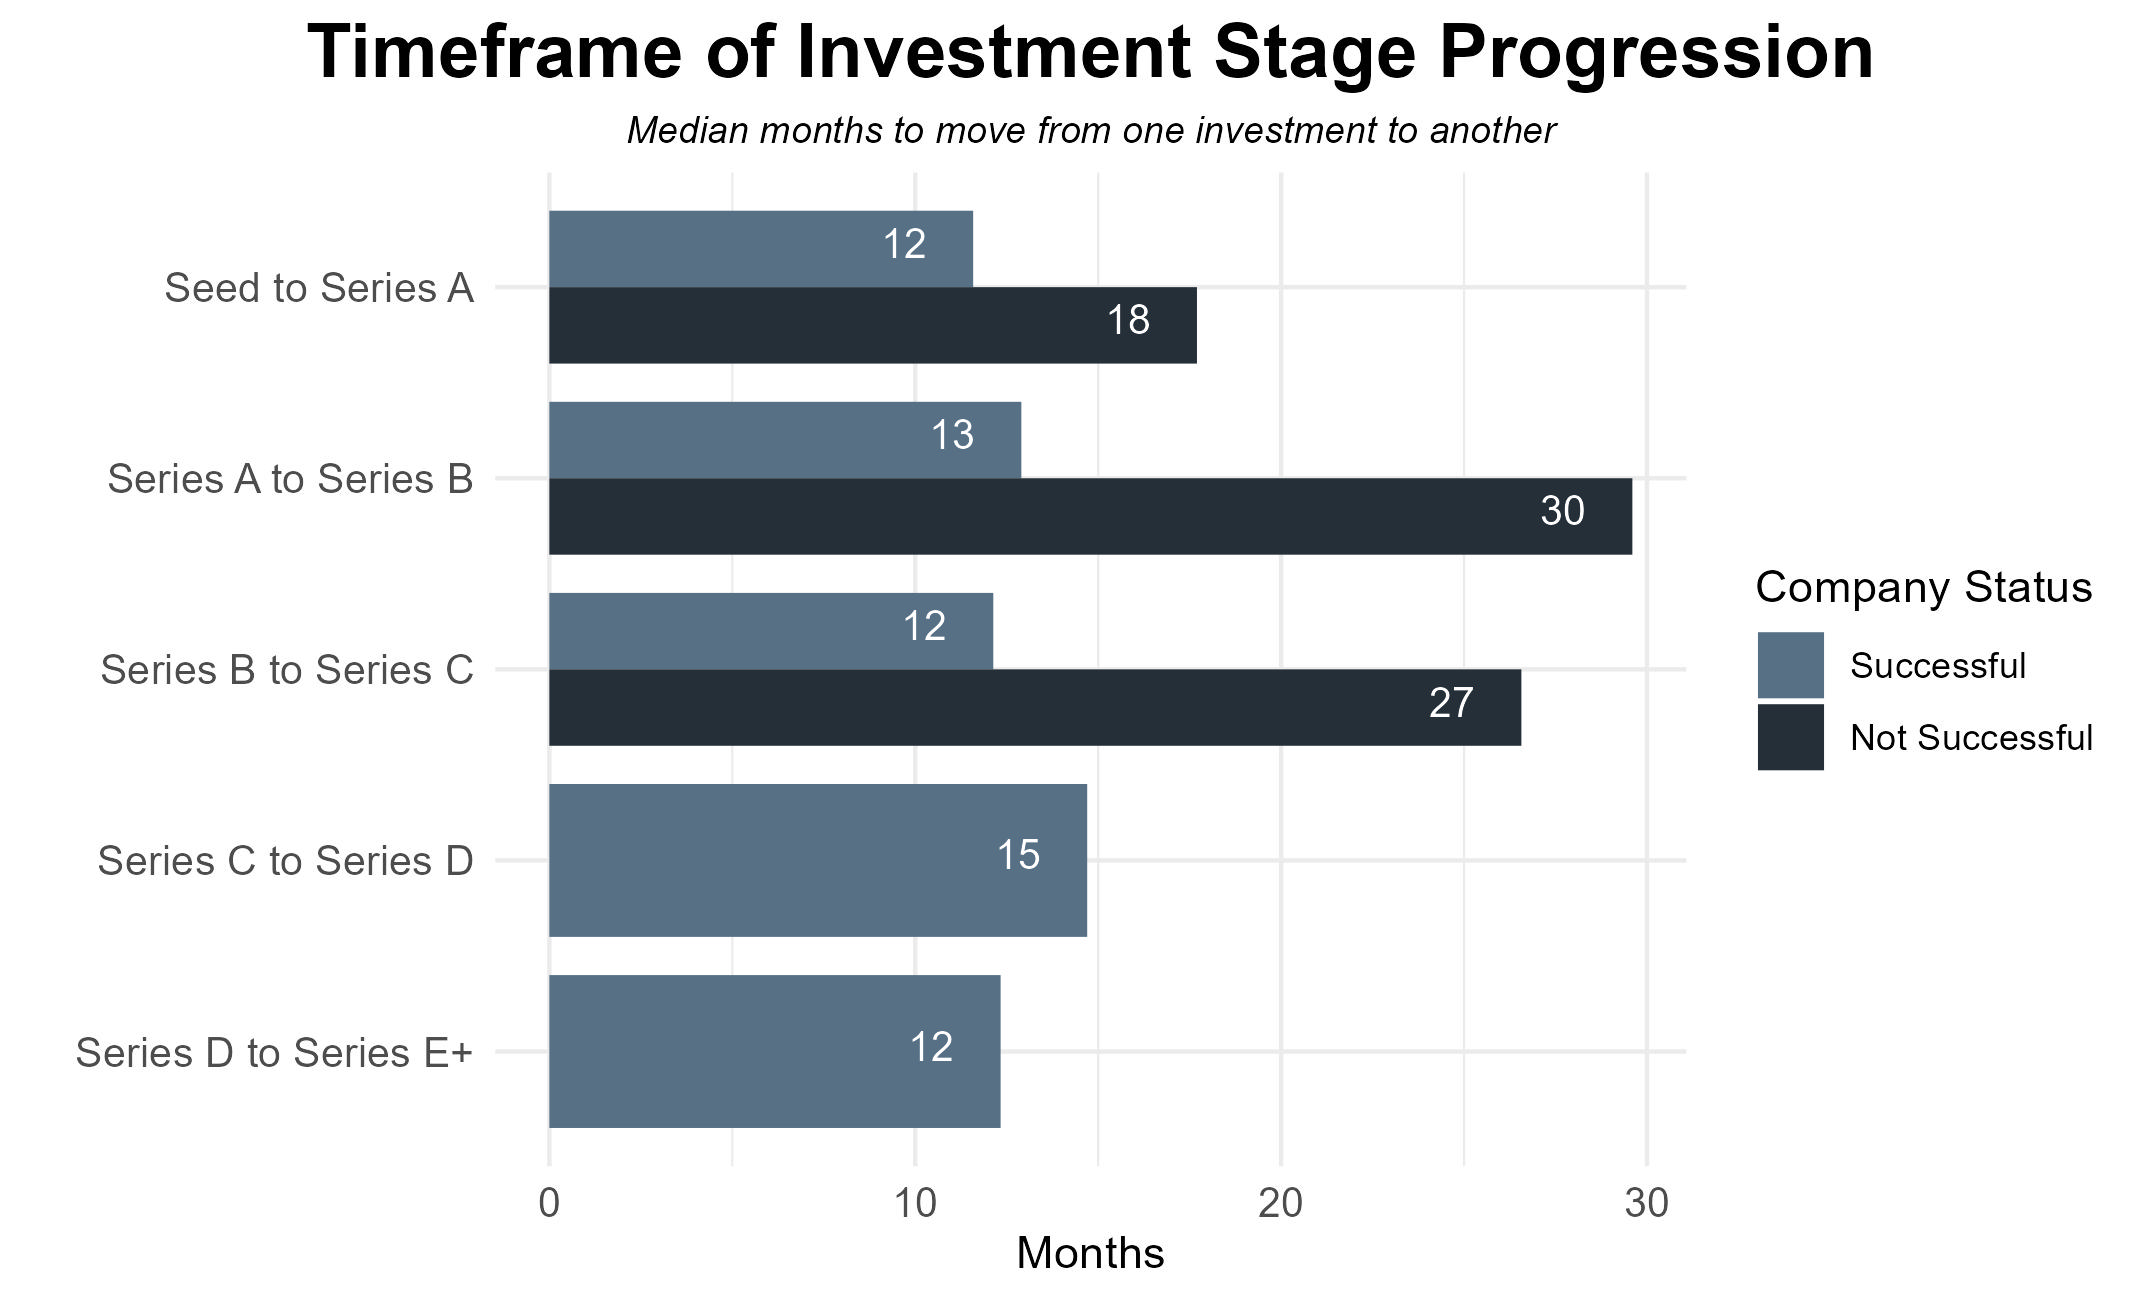
Time to move across rounds:
- Solo Founders can take up to twice as more months than co-founder teams when securing a funding round

Area Under the Curve for logistic regression model:
| AUC for testing dataset| AUC for training dataset | |:———————–:|:————————:| | 94.1% | 93.9% |
Predictions on real world data:
| Chance of Company A being successful | Chance of Company B being successful | |:————————————:|:————————————:| | 87% | 9% |
LinkedIn Company Demographics Scrapper
This project significantly enhanced the efficiency of data scraping from company profiles, providing tangible benefits to Endeavor Mexico.
- The code is fully prepared for use and deployment across different computers. Note for first-time Selenium users: Please ensure to install necessary libraries to prevent any errors.
- Code only needs a list with the URLs to retrieve in a .csv format.
- Added value: The scraper retrieves comprehensive employee demographic information, including locations, majors, skills, and occupations.
- Executing all the provided code will yield a clean, ready-to-analyze data frame for any required analysis.
Data Frame output glimpse:
| Company Name | Industry | Location | Employees | N1_Country | Country1 | N1_School | School1 | N1_Major | Major1 | |:—:|:—:|:—:|:—:|:—:|:—:|:—:|:—:|:—:|:—:| | STUCK? | Education | Al Rabie District, Riyadh | 8 | 2 | Egypt | 4 | University of Oxford | 3 | Teacher Education Multiple Levels | | THIQAH | IT Services and IT Consulting | Al Sahafah Dist, Riyadh | 1100 | 916 | Saudi Arabia | 218 | King Saud University | 169 | Computer Science | | MRSOOL | مرسول | Technology, Information and Internet | Riyadh, RIYADH | 500 | 1343 | Saudi Arabia | 37 | King Saud University | 35 | Computer Science | | Dsquares | Technology, Information and Internet | Riyadh | 4 | 170 | Egypt | 30 | Cairo University | 32 | Computer Science | | Soum | Internet Marketplace Platforms | Riyadh | 61 | 43 | Saudi Arabia | 11 | King Fahd University of Petroleum & Minerals | 6 | Industrial Engineering |
Sports Analytics
Explore my portfolio of sports-related projects where I blend my passion for data analysis with my love for sports.
Tracking NBA Season Leaders Over a Decade:
- I’ve delved into the past decade’s box score data using SQLite for a deep-dive analysis.
- The goal of this project was to do data manipulation using SQL with a minimal touch-up on R.
- The resulting graph paints an exciting picture, highlighting the league’s top performers across key stats like: 3PT%, PPG, Assists, and Rebounds.
- SQL Queries & Data Source

A Deep Dive Into Luka Doncic’s 60-Point Game: Shot Chart Analysis:
- Luka had a record-breaking game on december 27, 2022. What was his shot selection and shot making during that game?
